Pacific map
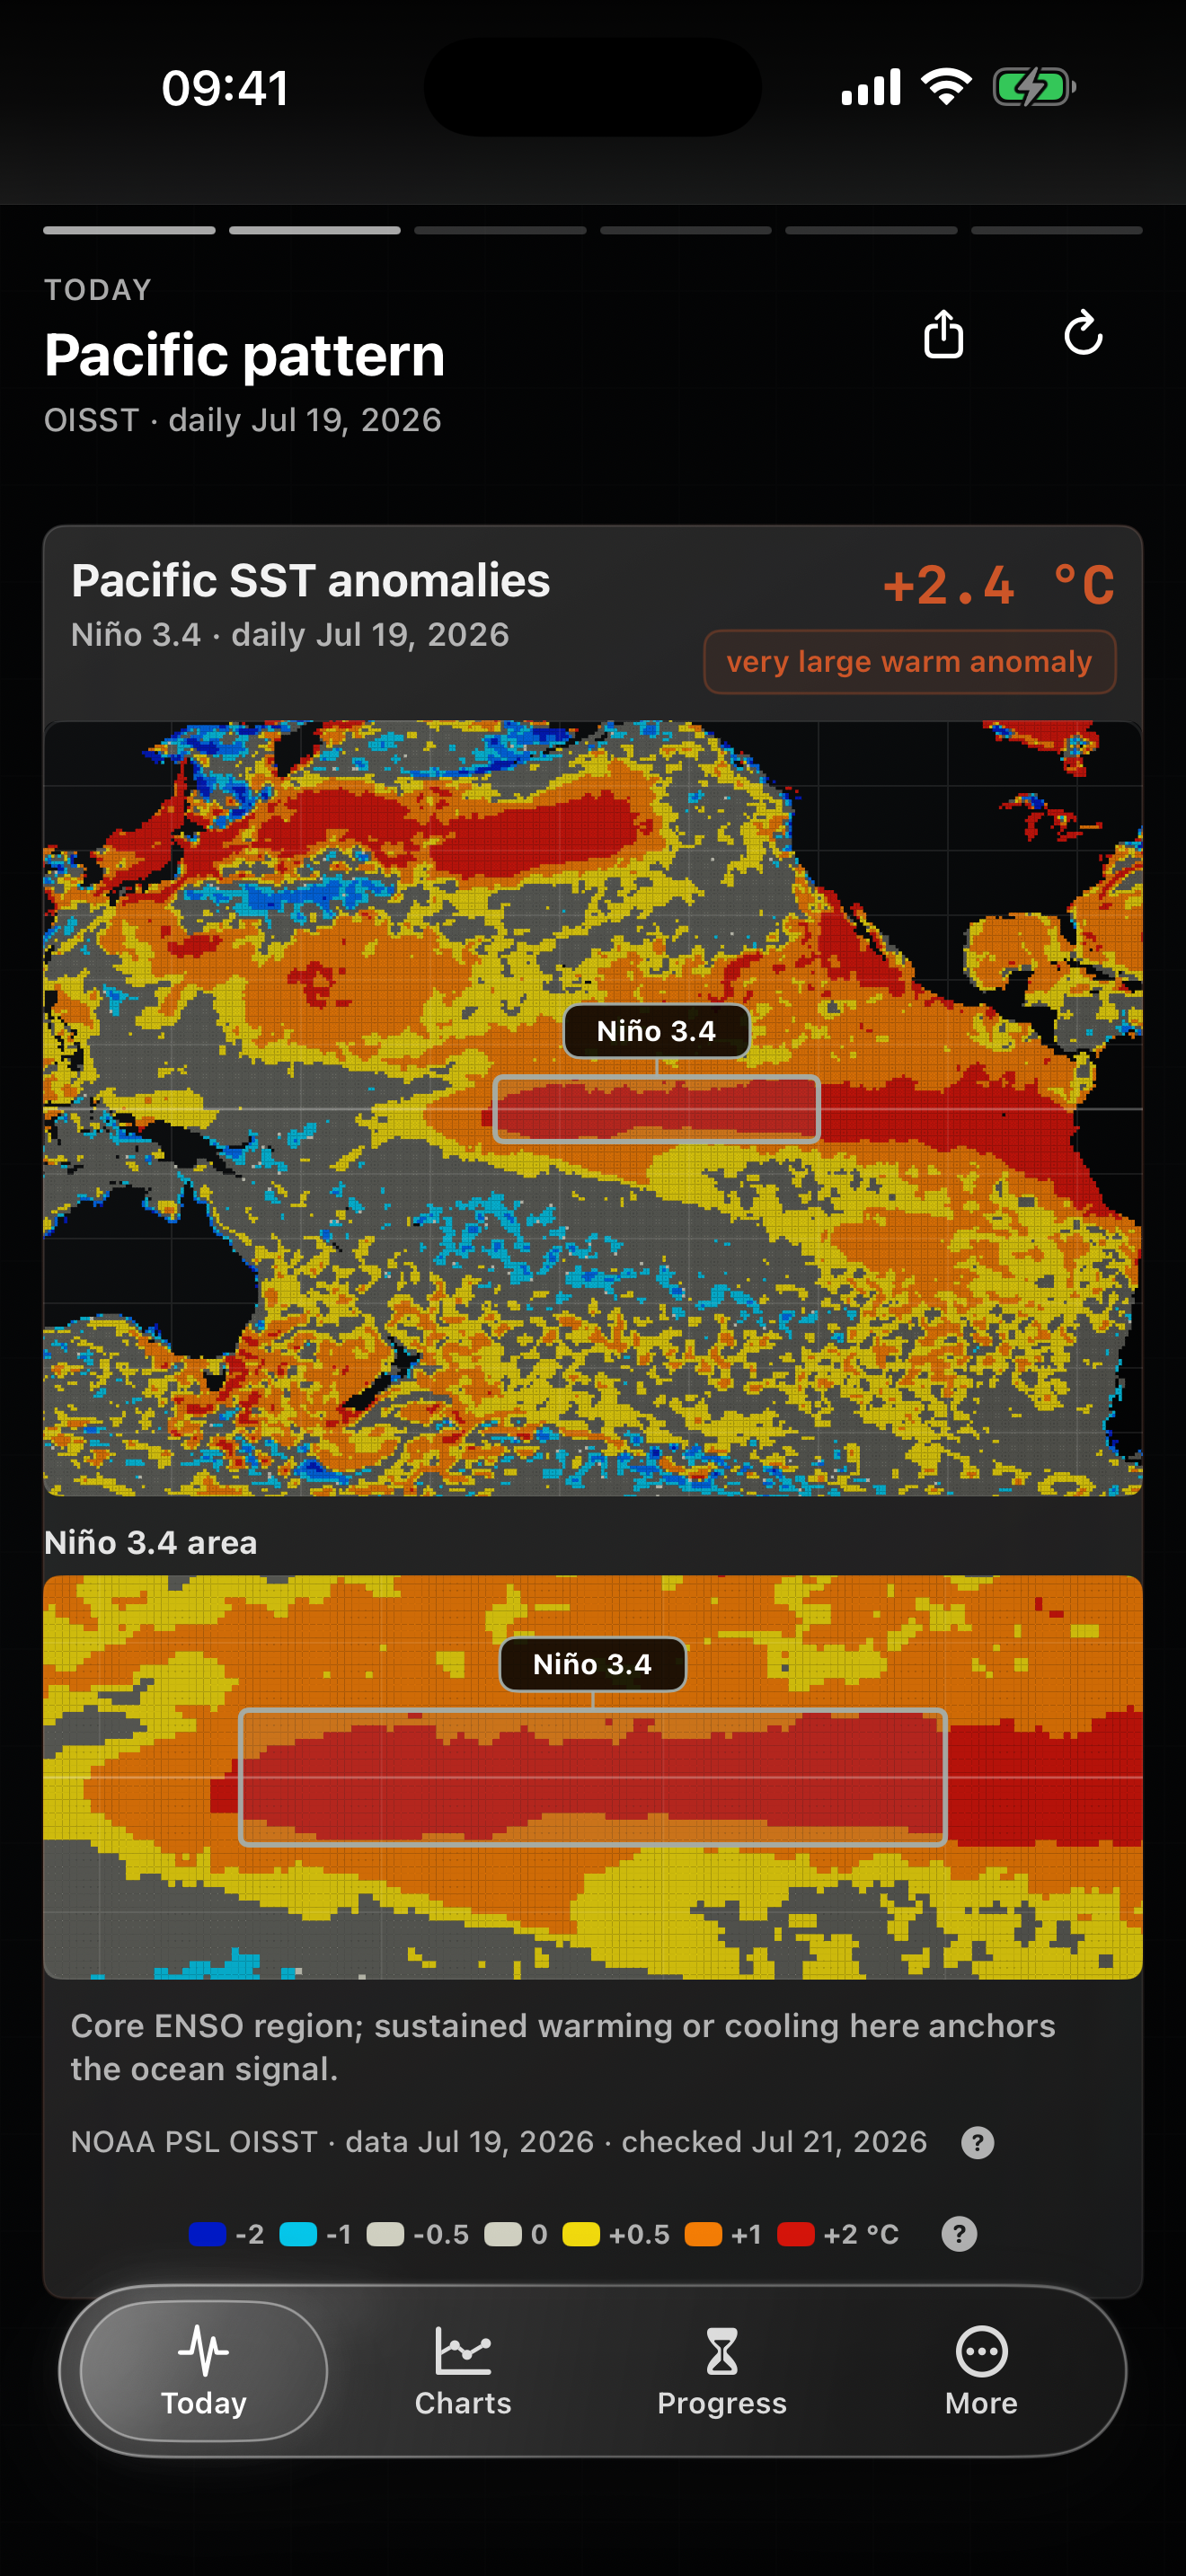
See where the Pacific is warmer or cooler than usual.
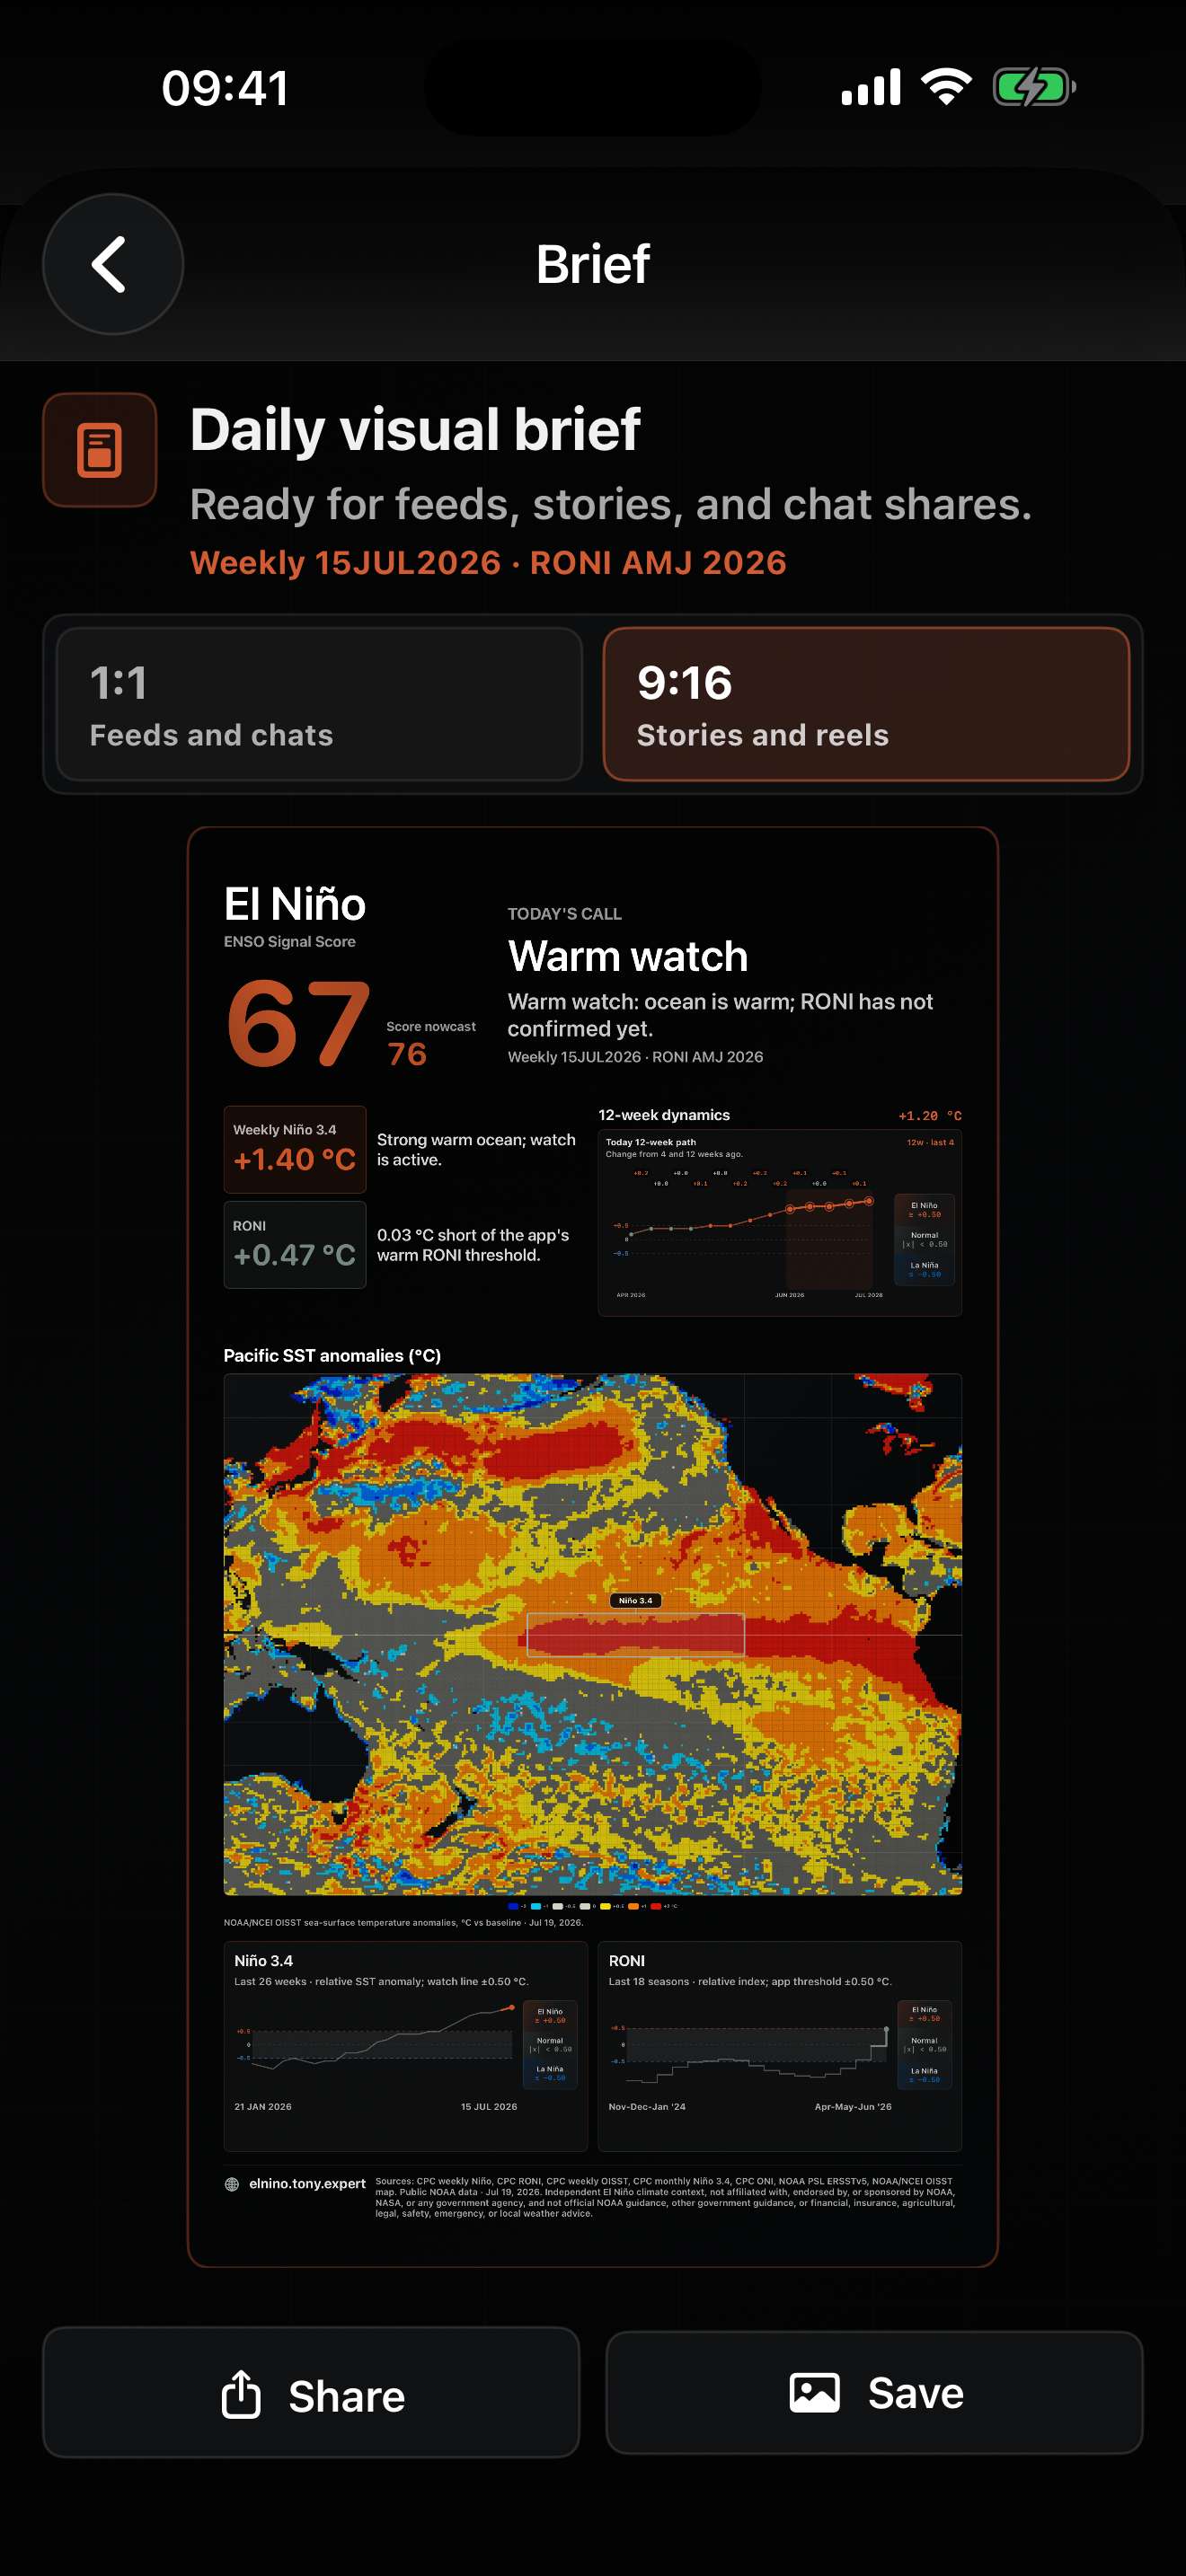
The map marks Niño 3.4, the part of the tropical Pacific scientists watch most closely for El Niño and La Niña.
 El Niño
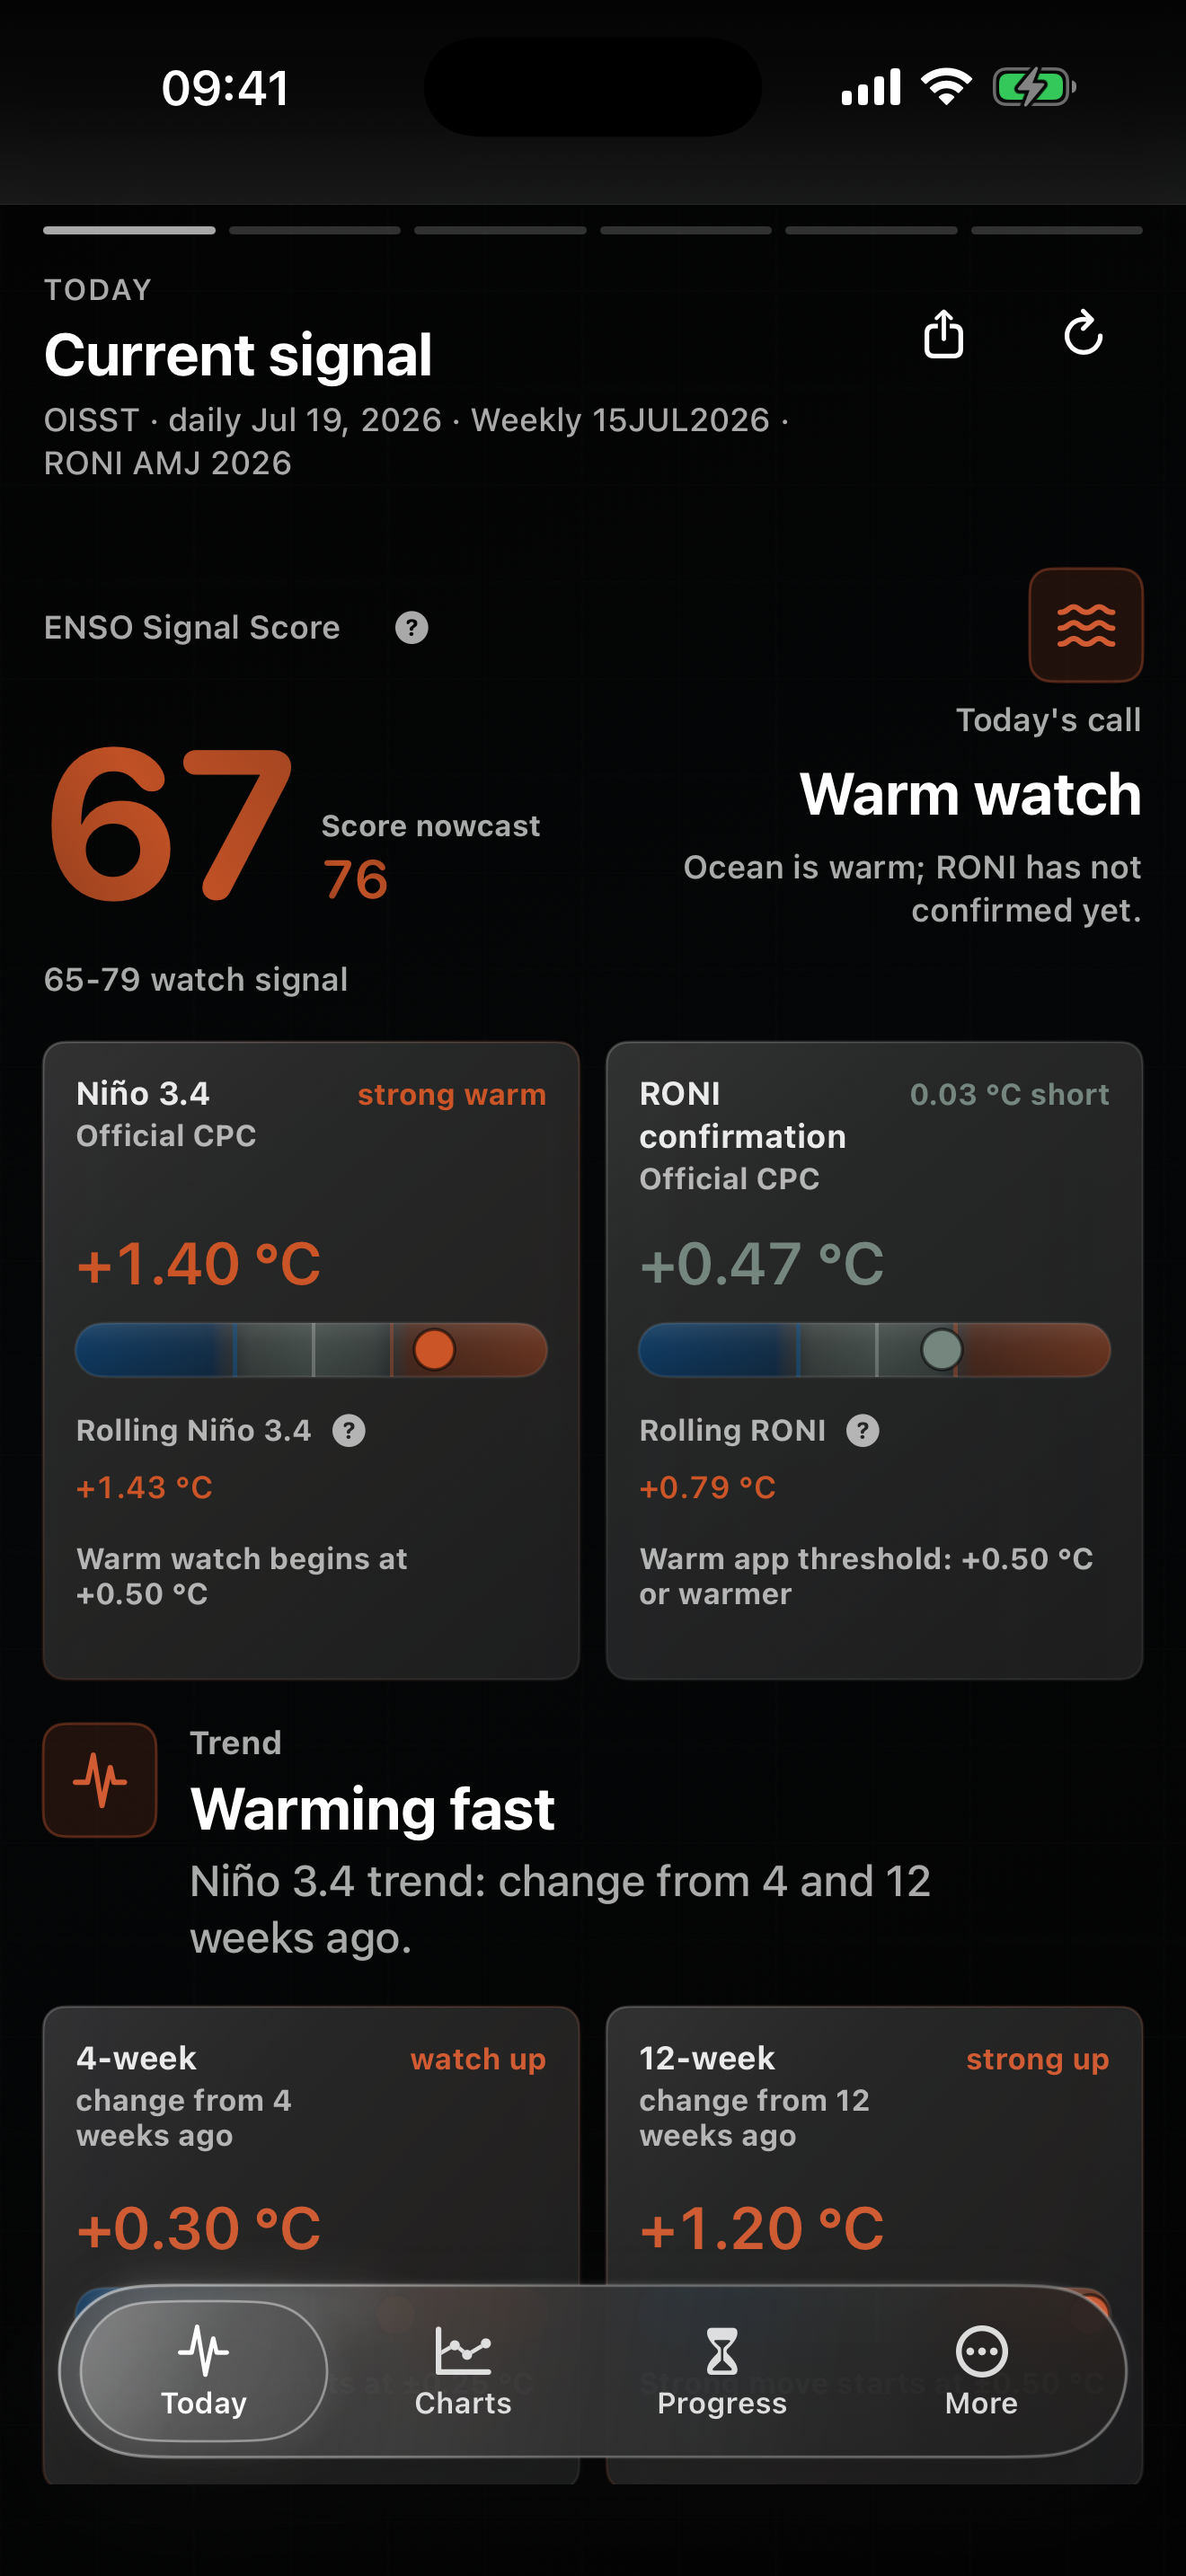
Live NOAA data shows whether the tropical Pacific is warming, cooling, or still uncertain.


Get your instance
Real El Niño users, mapped from App Store data
Ocean data: NOAA PSL OISST v2.1 · Land data: Natural Earth
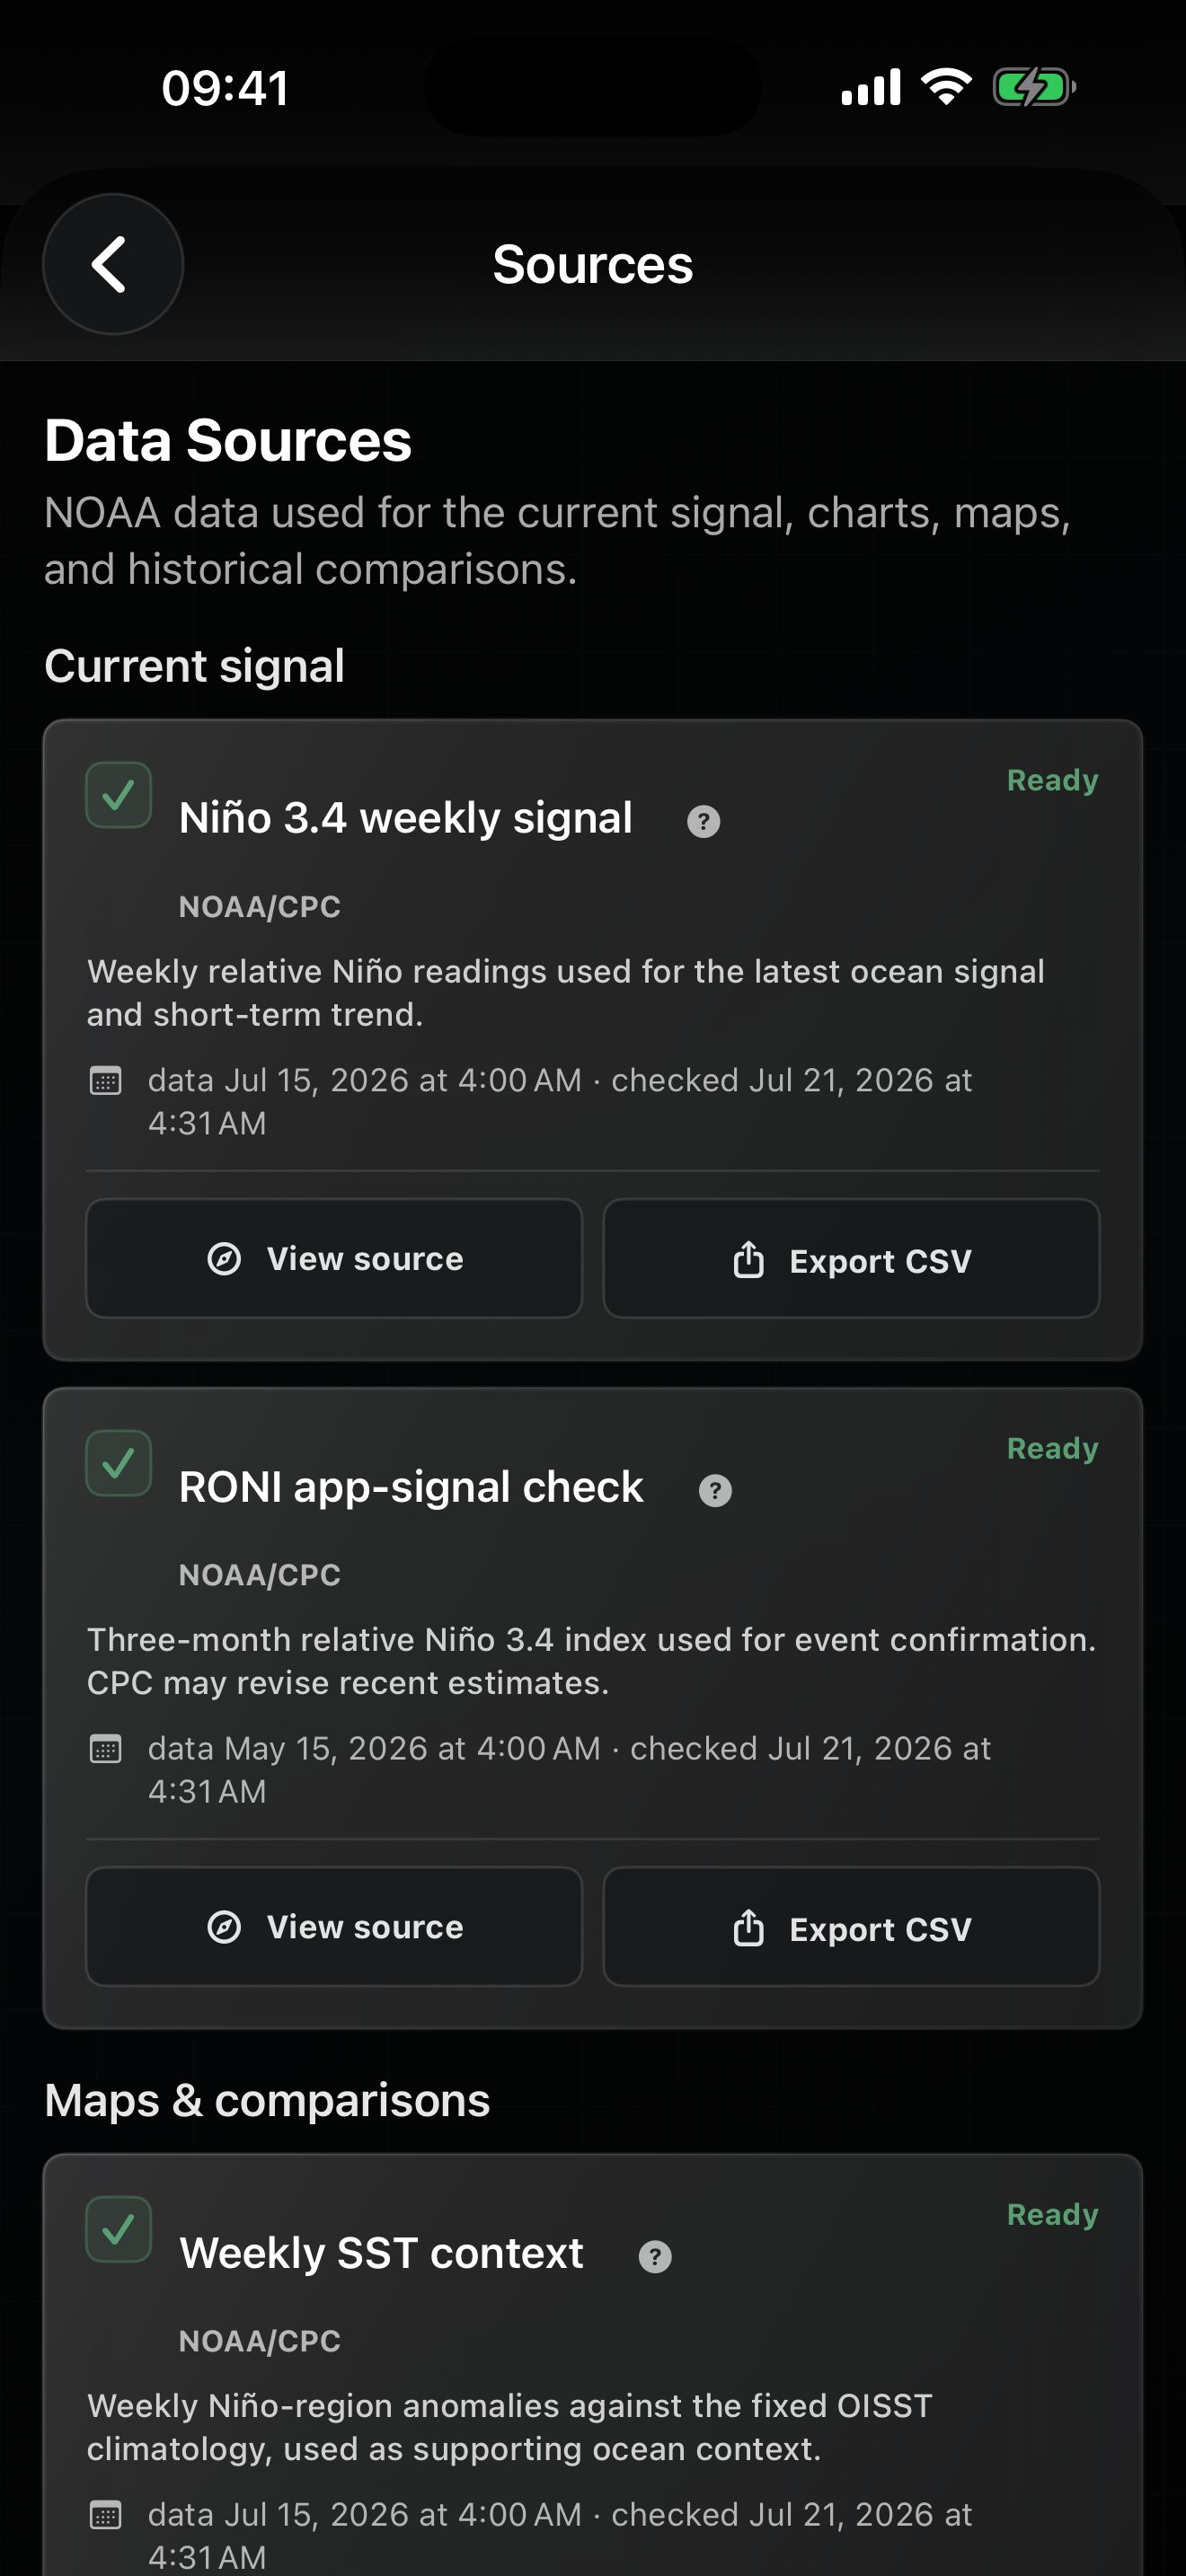
The Today screen starts with a simple summary. Open the maps, charts, past events, or source details when you want to see why.
The map marks Niño 3.4, the part of the tropical Pacific scientists watch most closely for El Niño and La Niña.
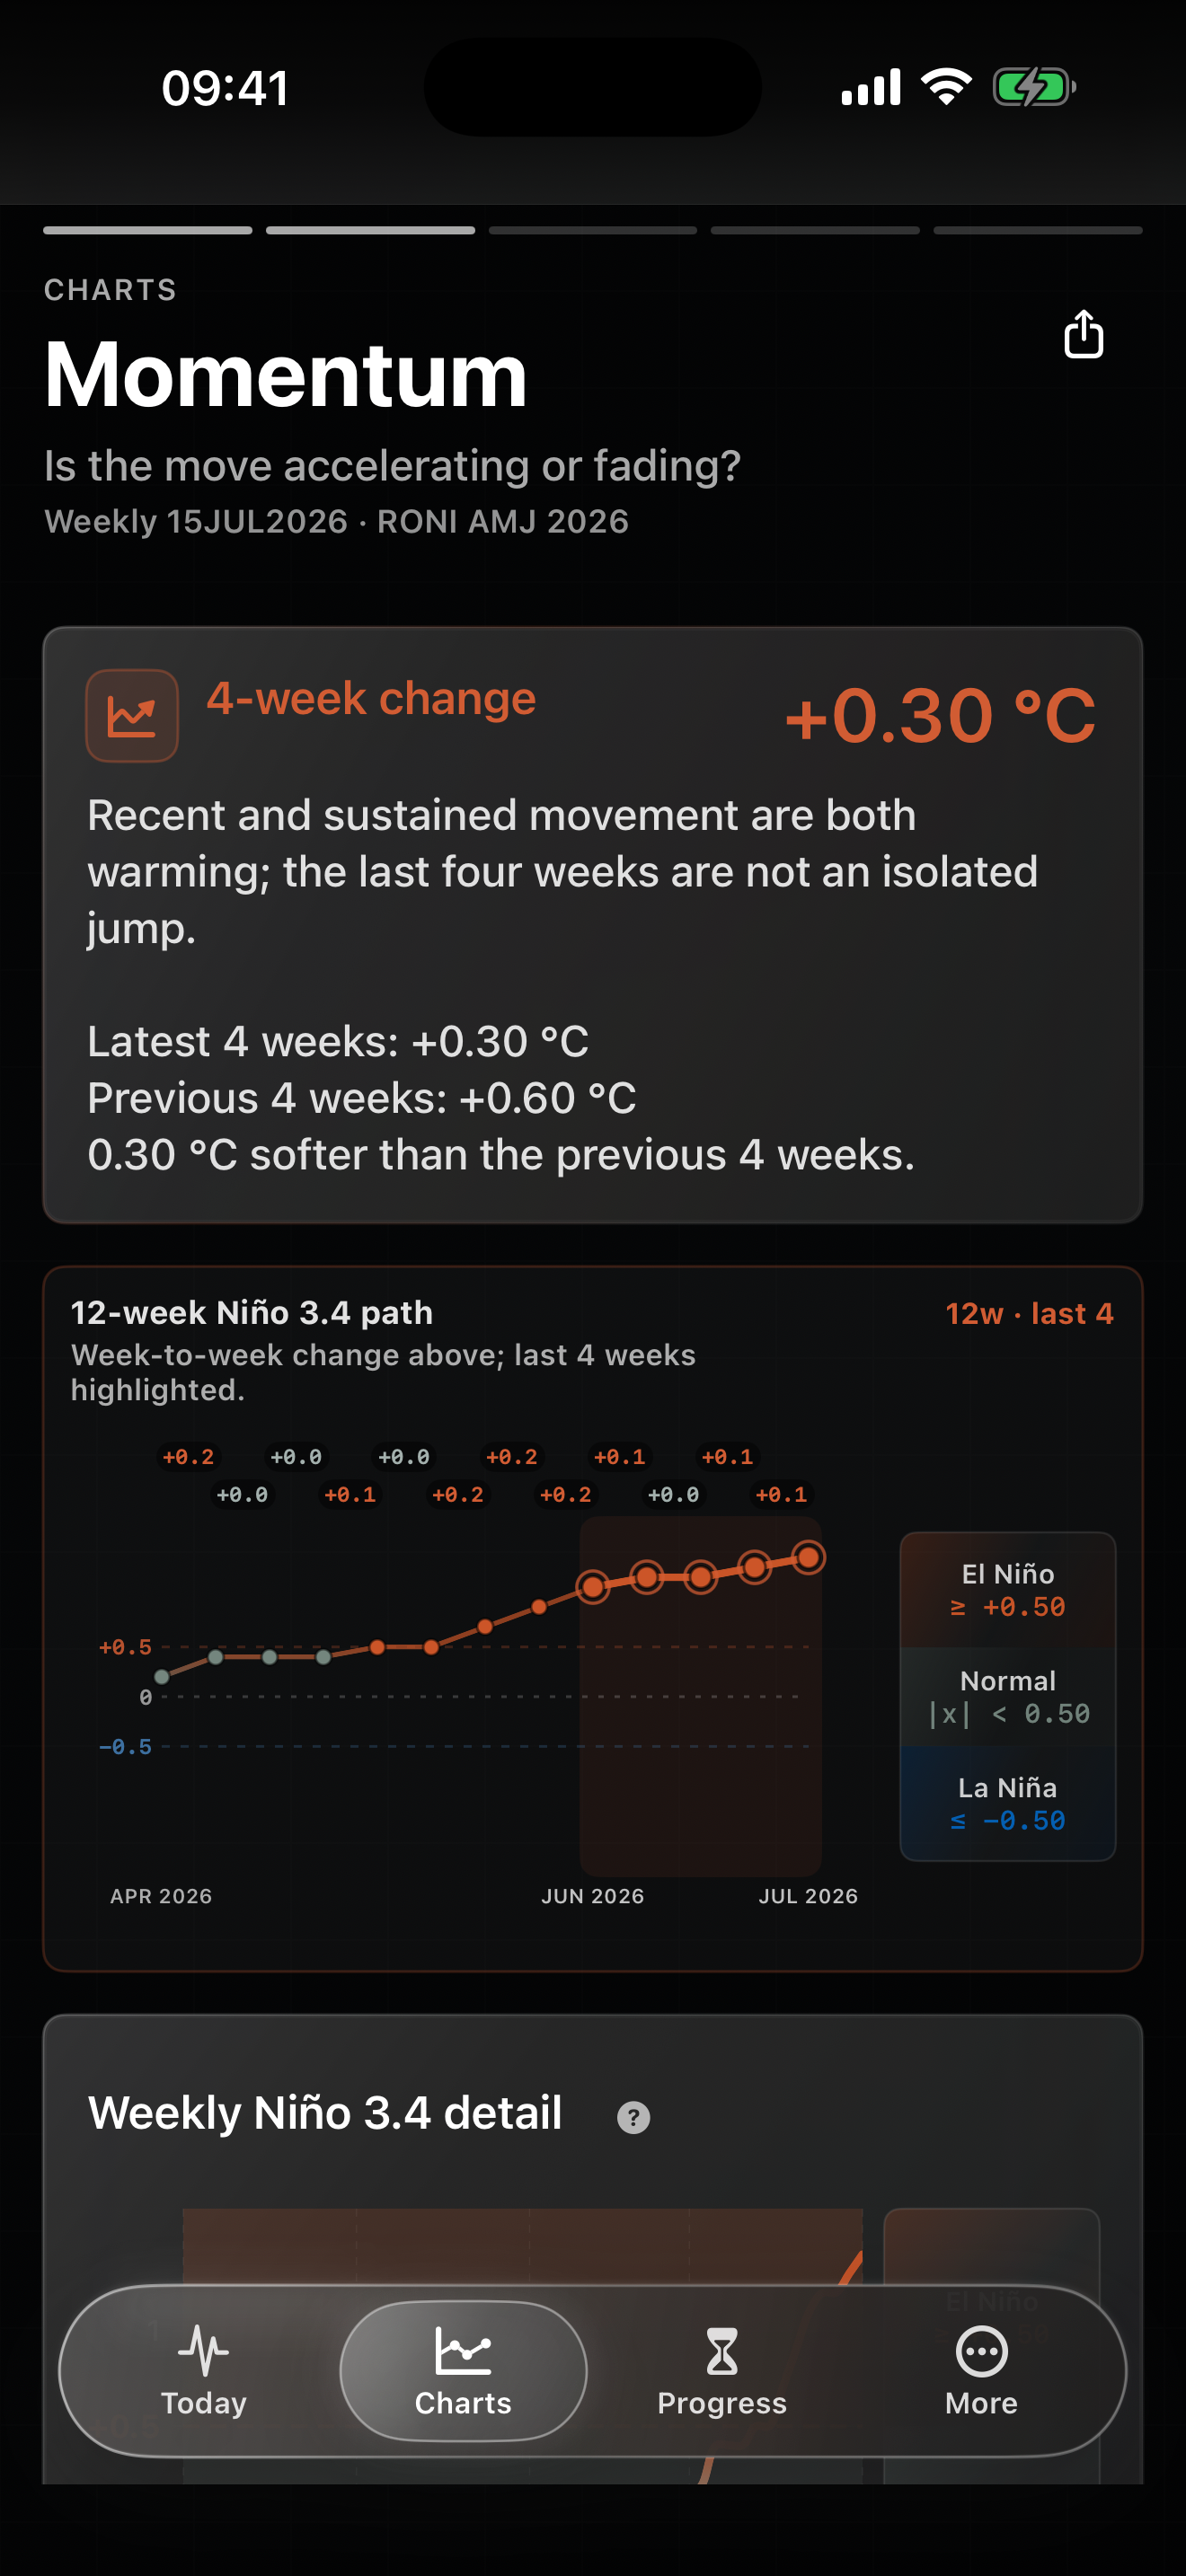
Weekly and monthly charts show how ocean temperatures are changing and whether the air and winds above the Pacific are changing too.
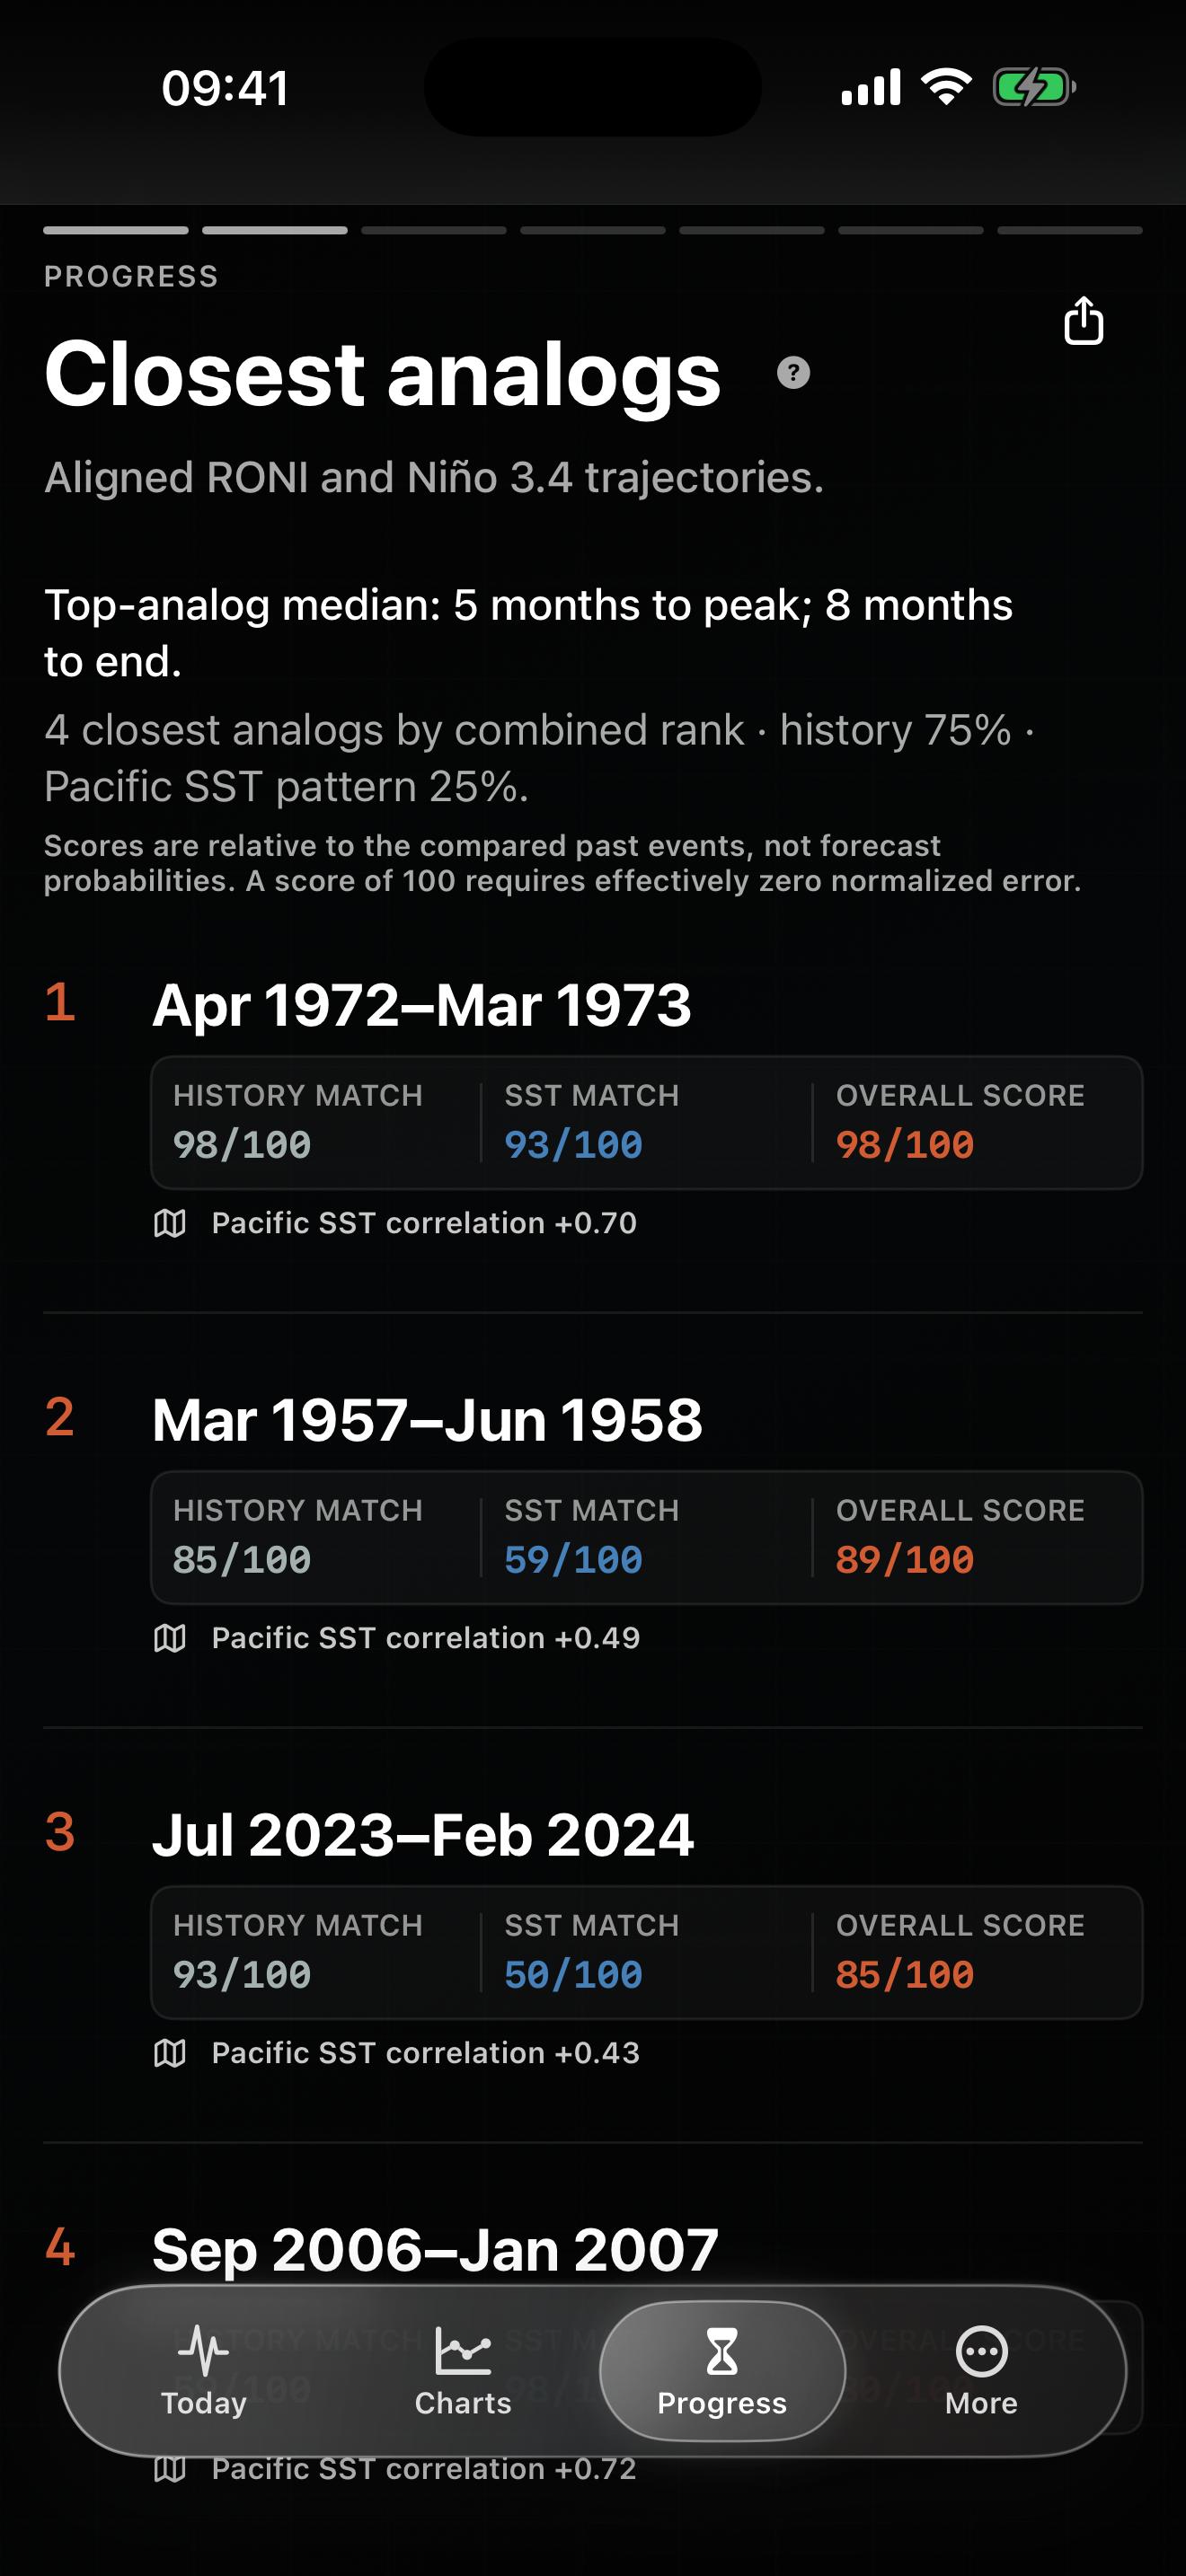
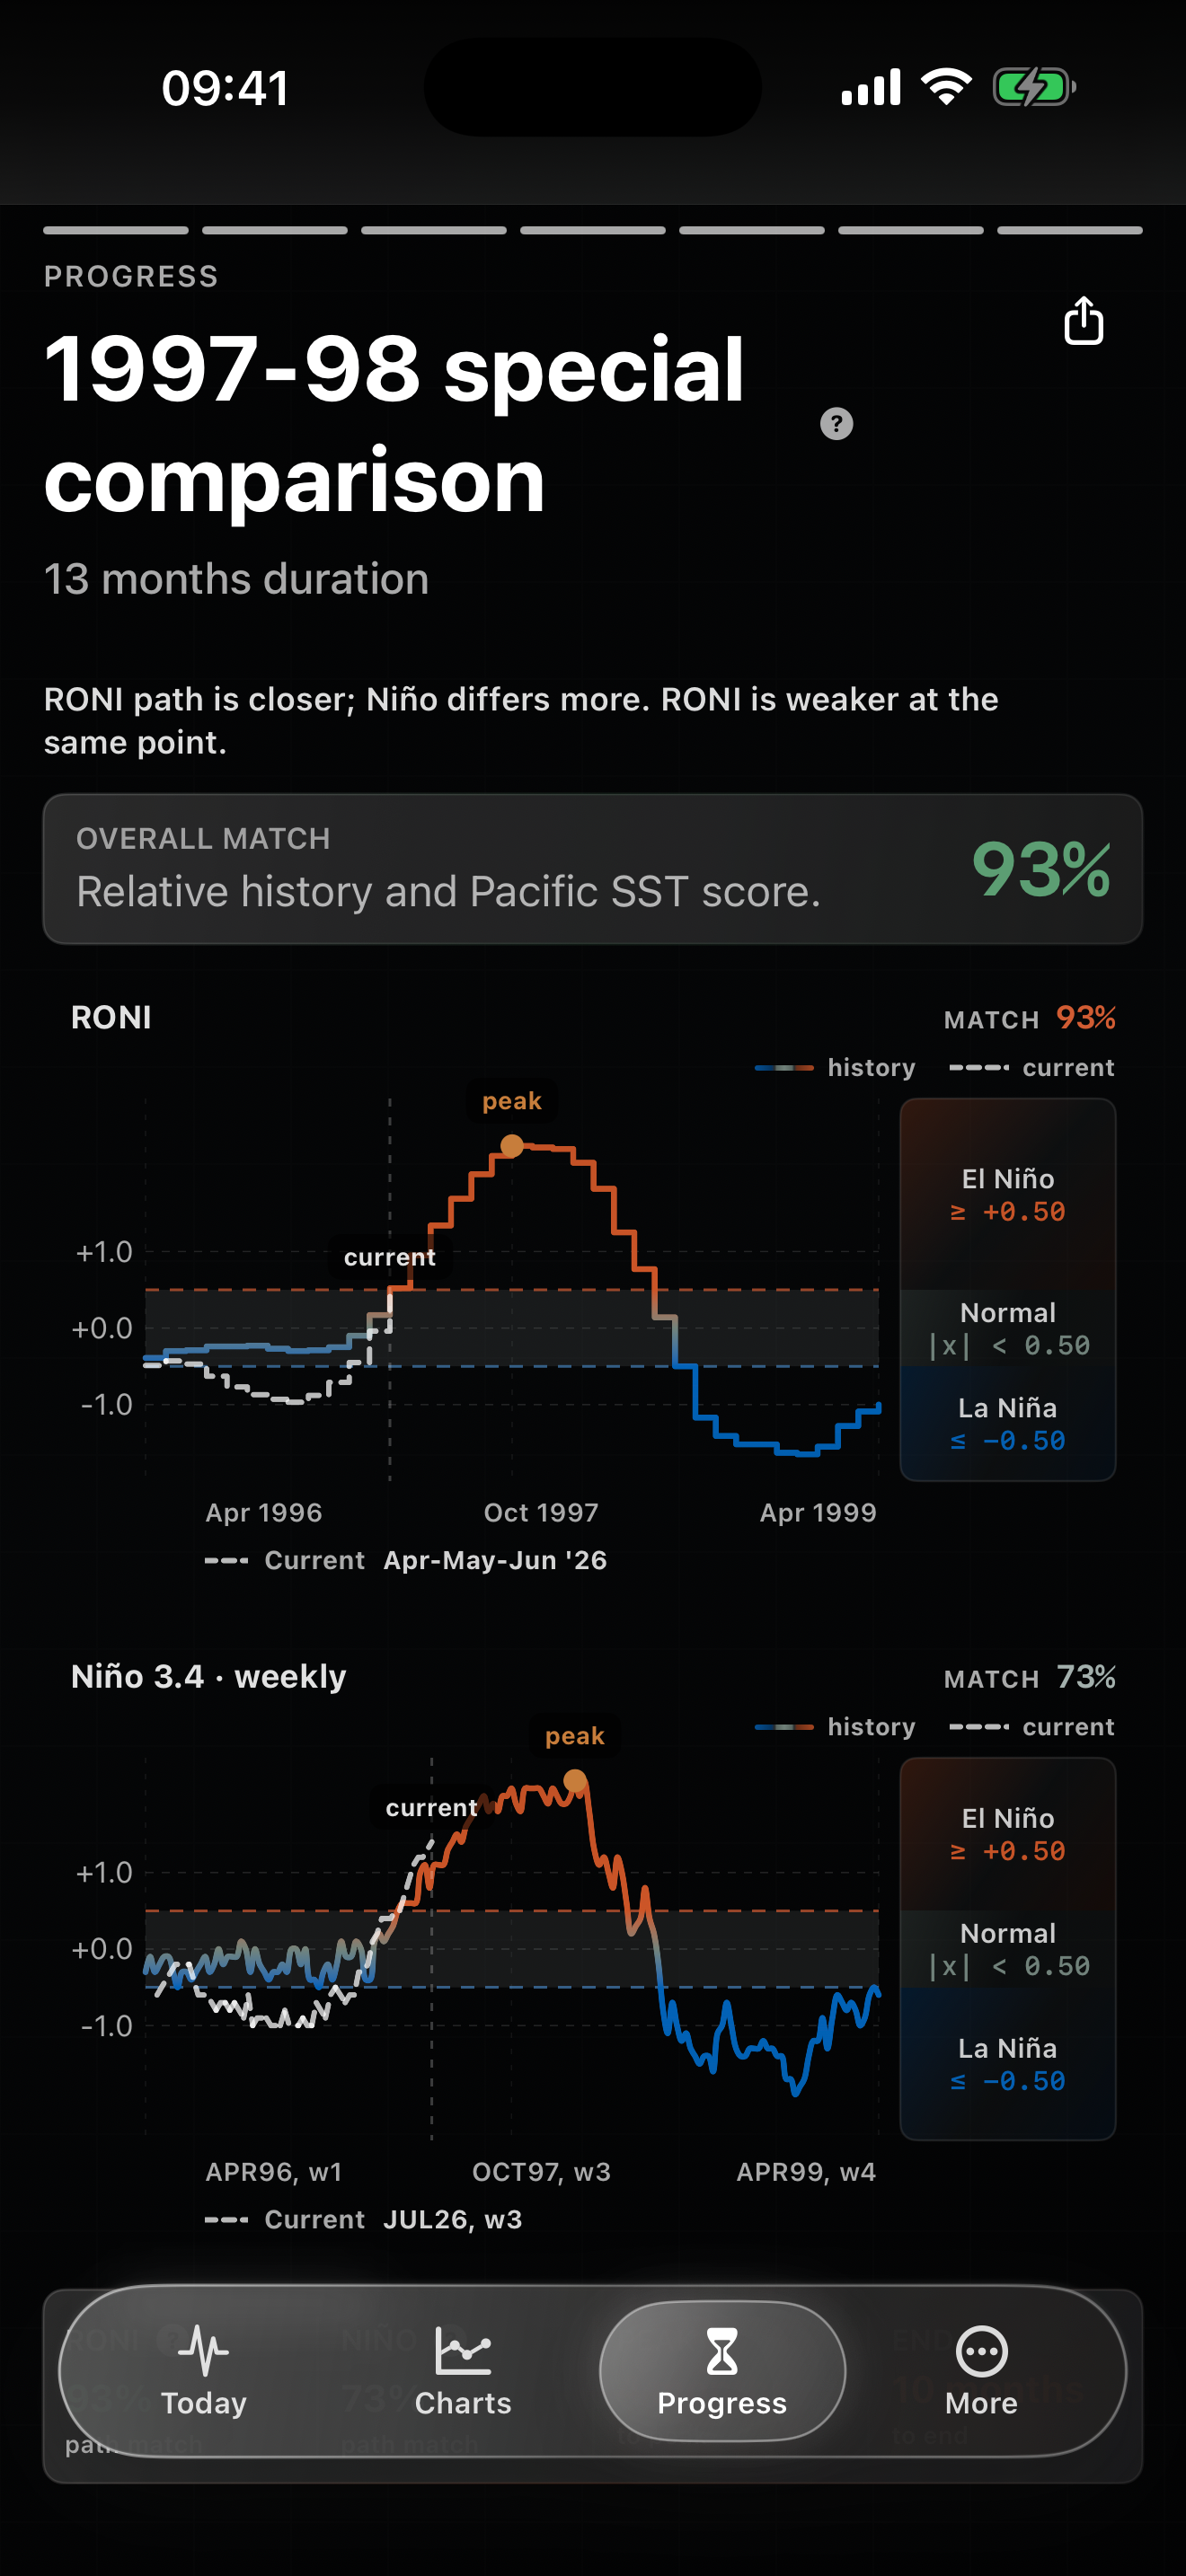
See which completed El Niño events look most like today, then compare how temperatures changed before and after their peak. Similarity adds context; it does not predict what happens next.
ENSO is the name for the Pacific cycle that includes El Niño and La Niña. The 0–100 ENSO Signal Score combines ocean temperatures with changes in the air above the Pacific. A higher score means the signs agree more clearly; it does not mean El Niño is certain.
Get the current picture, maps, charts, past events, widgets, and updates you can share.